
One of the most frustrating aspects of data analysis is receiving a file formatted for printing rather than processing.
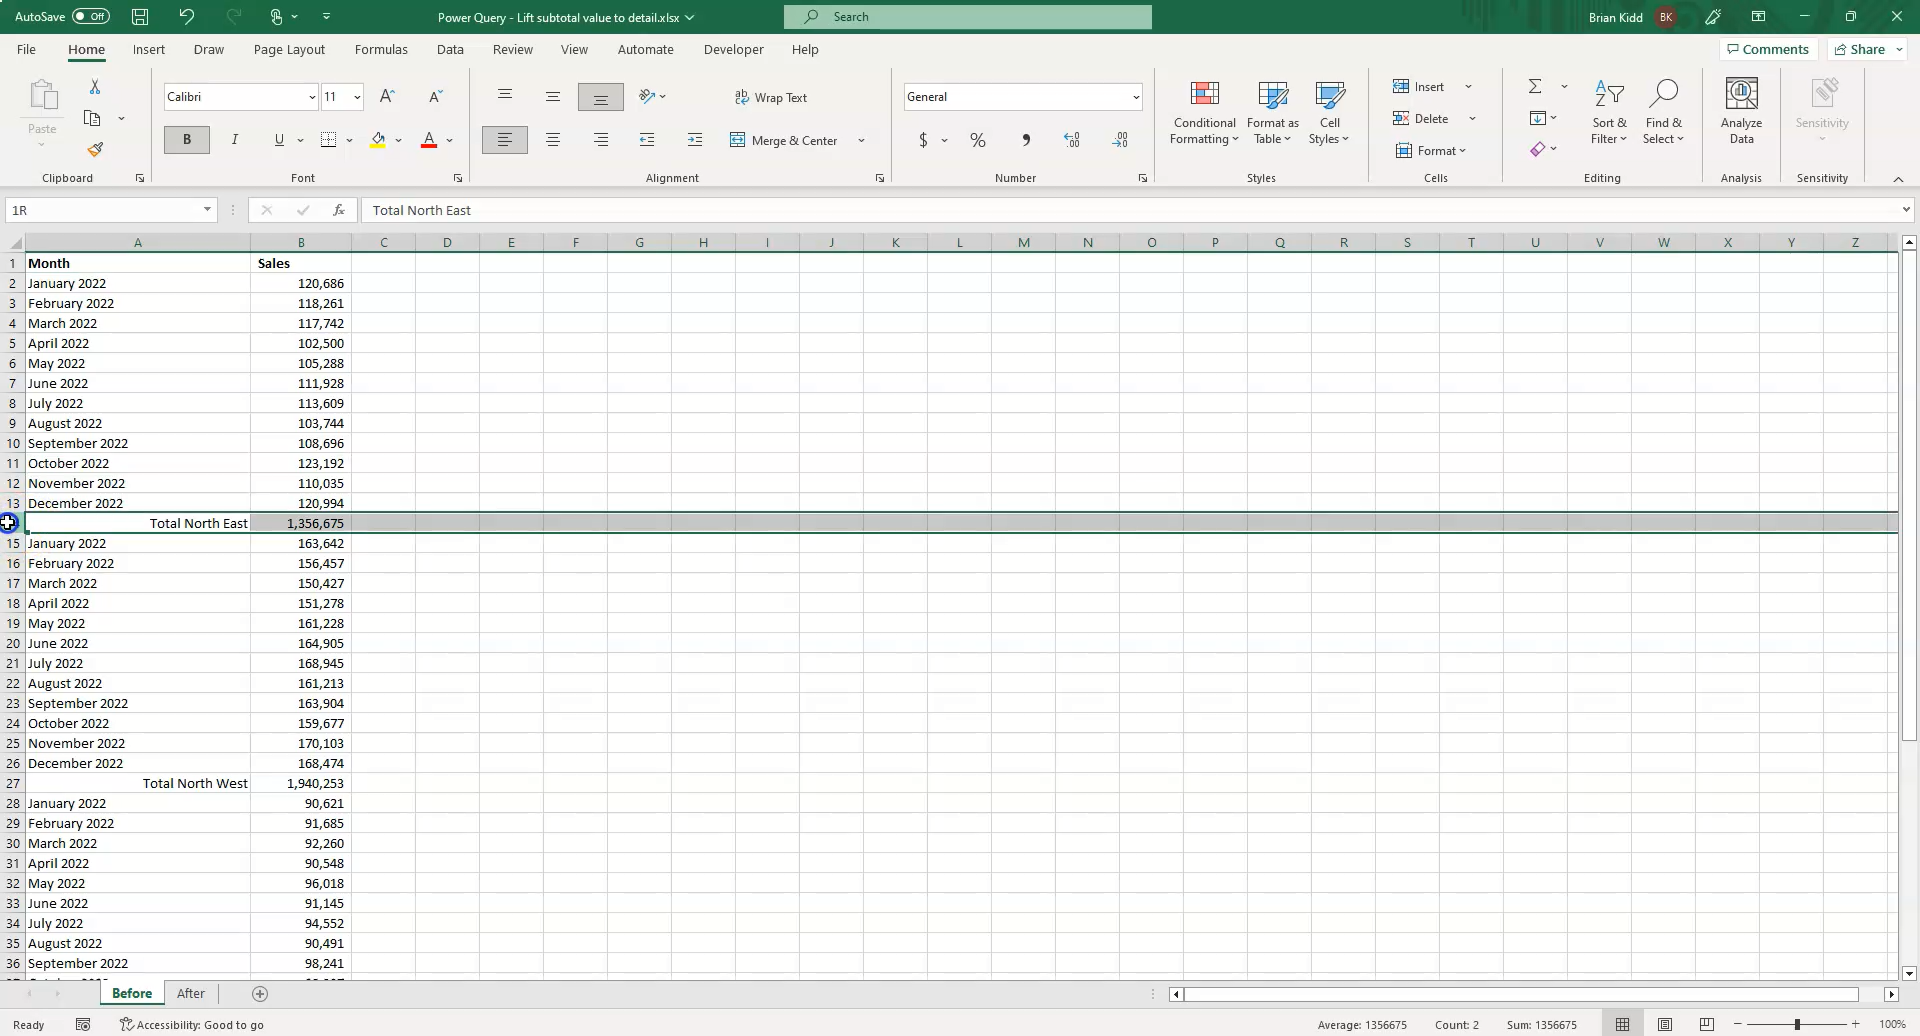
You know the file: it looks like a finished report. It has blocks of monthly data, and at the very bottom of each block, there is a "Total" row that contains the category name (e.g., "Total North East").
While this looks nice on paper, it is a nightmare for Pivot Tables. To analyze this data, you need that category name ("North East") associated with every single row of data, not just the total at the bottom.
Manually copying and pasting these headers is tedious and error-prone. Today, I’m going to show you how to automate this process using Excel Power Query, turning a static report into a dynamic dataset ready for analysis.
Step 1: Import and Initial Cleanup
First, load your data into Power Query. Go to the Data tab on the ribbon, select Get Data > From File > From Excel Workbook, and select your source file.
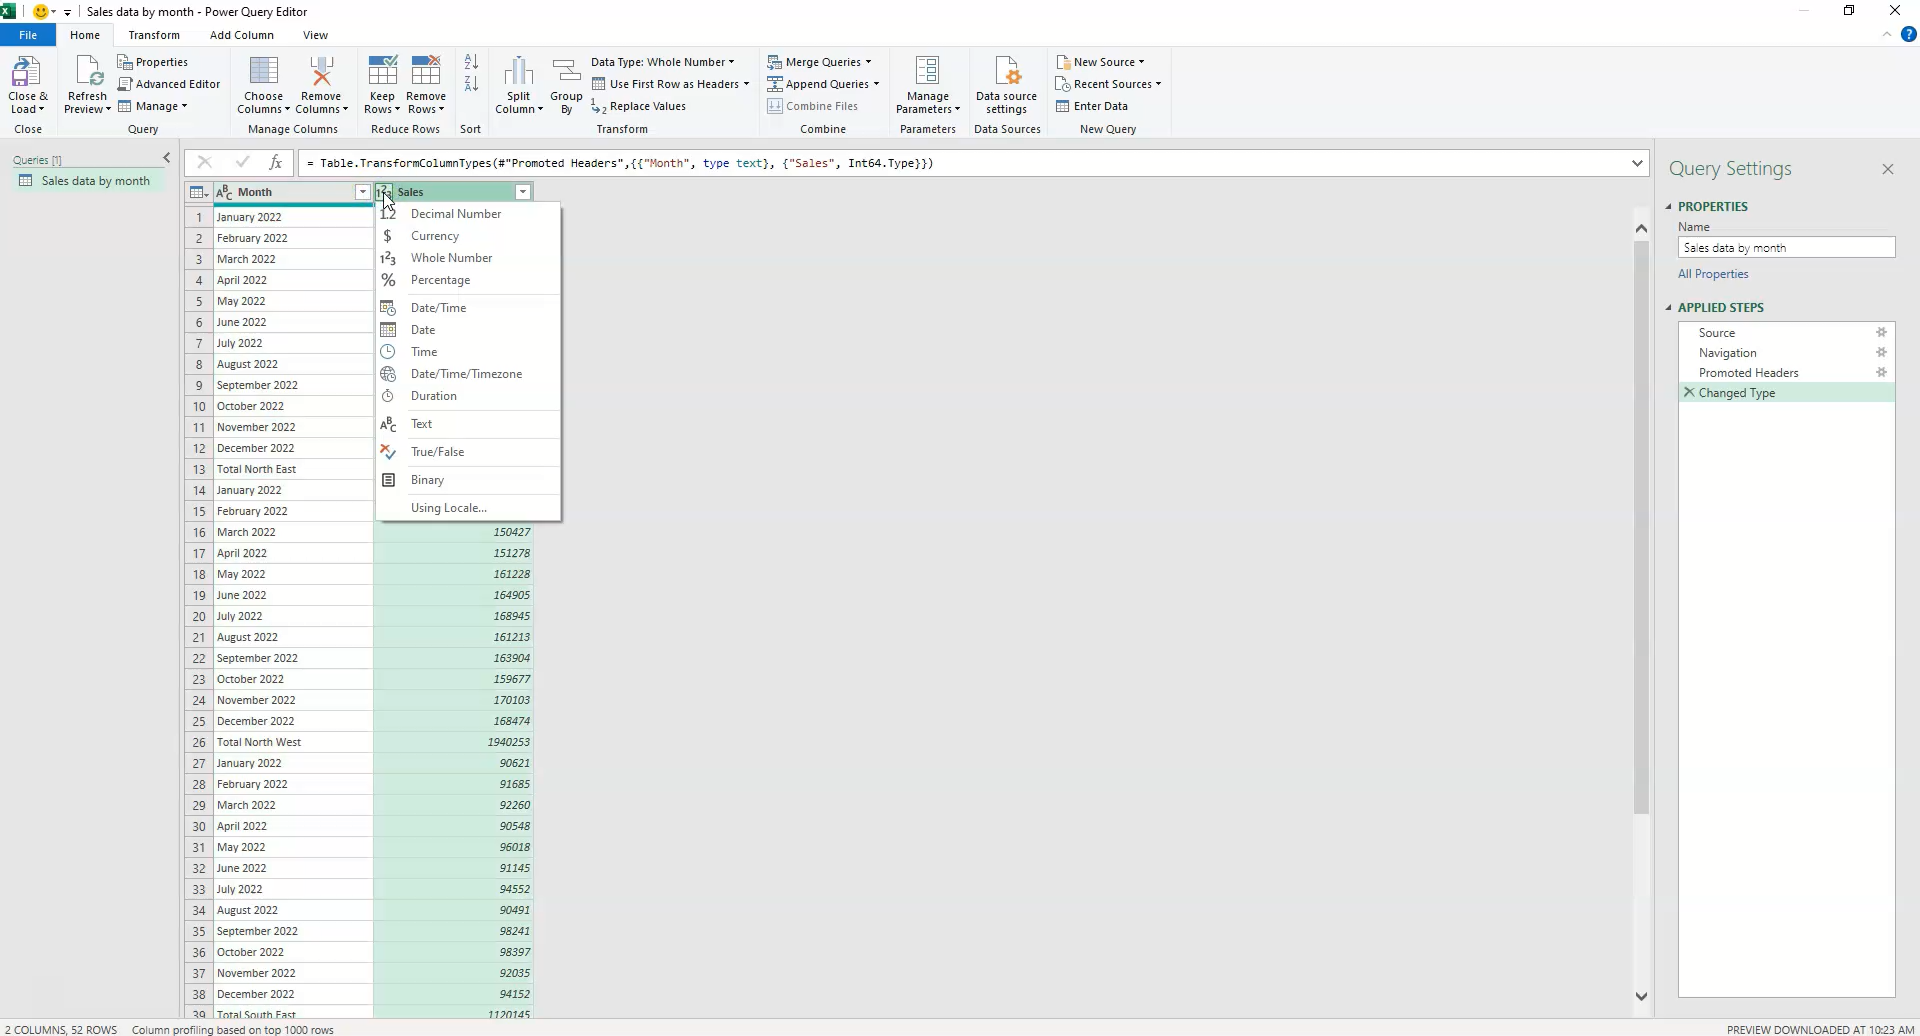
Once the Power Query Editor opens, check your data types.
Pro Tip: Power Query often guesses that sales data is an
Integer(whole number) if it doesn't see any decimals in the first few rows. Always manually change financial columns toDecimal NumberorCurrencyto prevent data loss on future updates.
Step 2: Identify the "Total" Rows
The goal is to move the region name (currently in the "Total" row) up to the detail rows. To do this, we first need to programmatically identify which rows are totals.
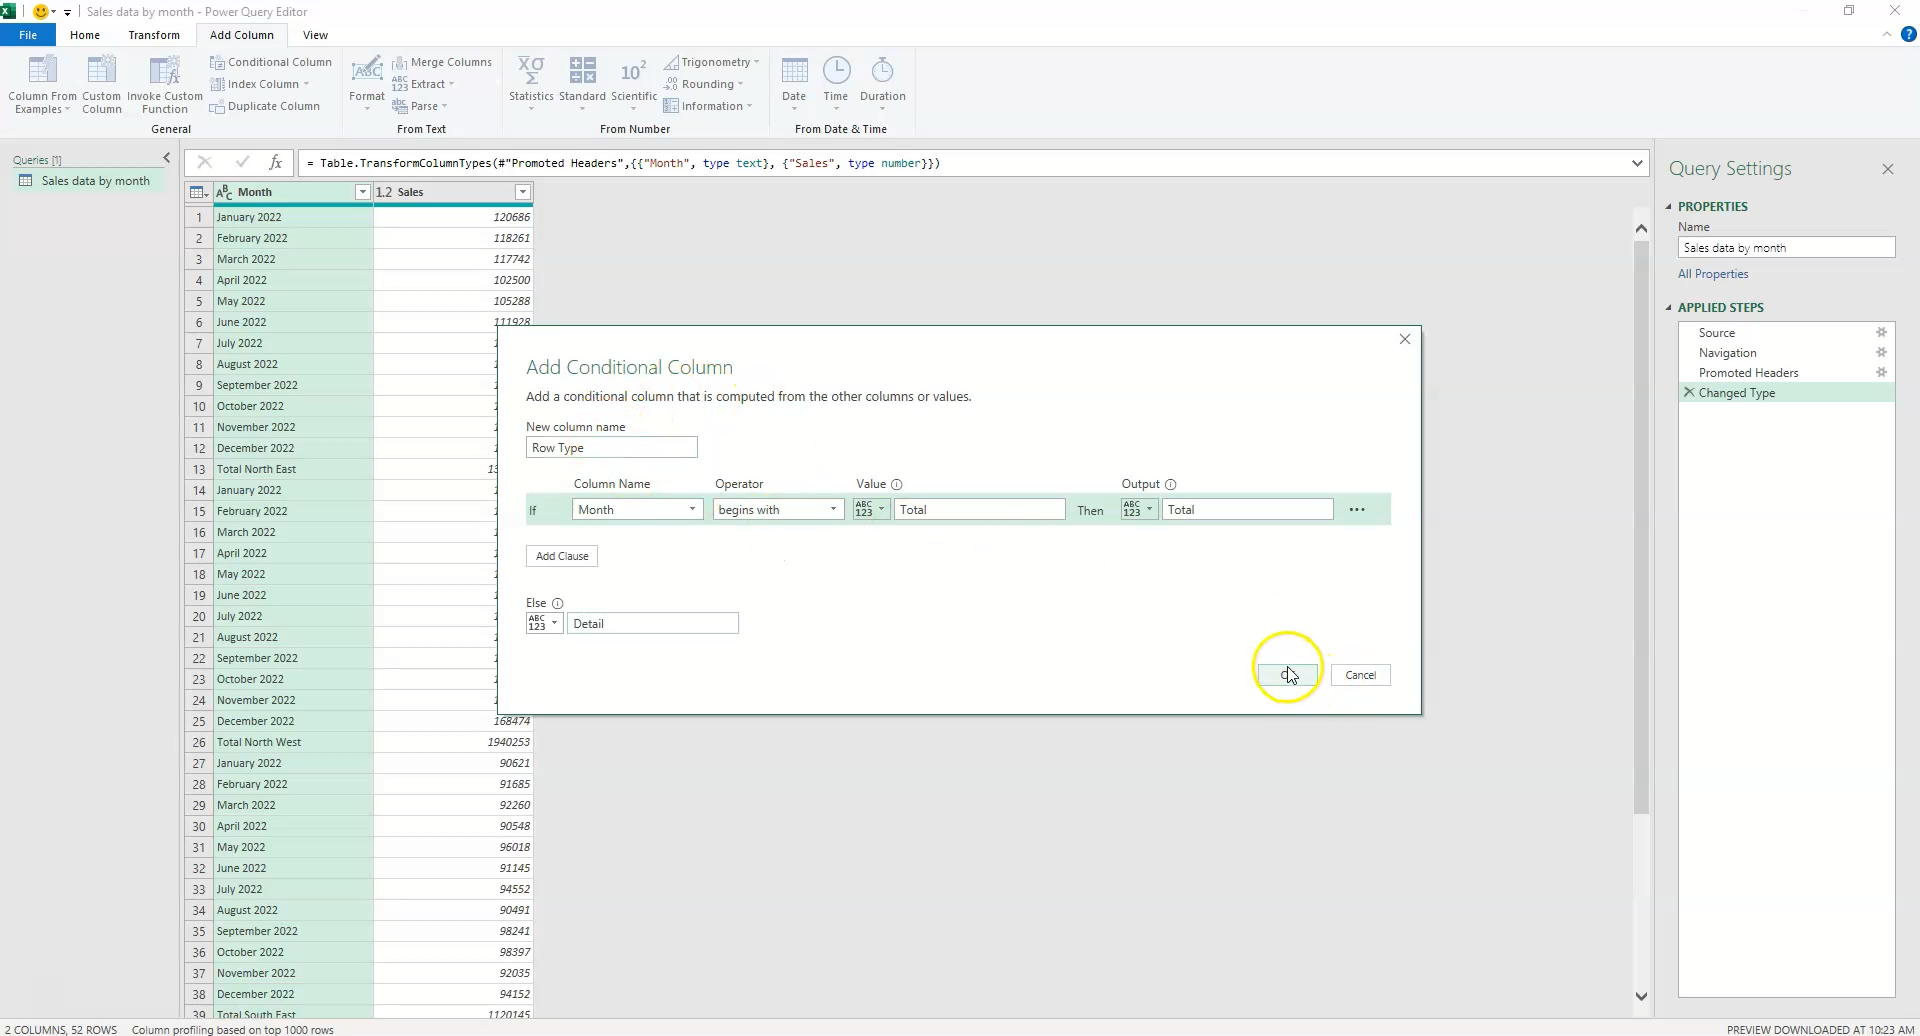
We will add a Conditional Column called Row Type.
- Go to Add Column > Conditional Column.
- Set the logic: If
Monthbegins with "Total", then output "Total", else output "Detail".
The Logic Behind the Step: This creates a helper column that flags the rows containing the information we need to extract.
Step 3: Extract the Region Name
Now that we have flagged the rows, we need to extract the text. We will create another Conditional Column called Region.
- Logic: If
Row Typeequals "Total", select the value from the Month column. - Else: return
null.
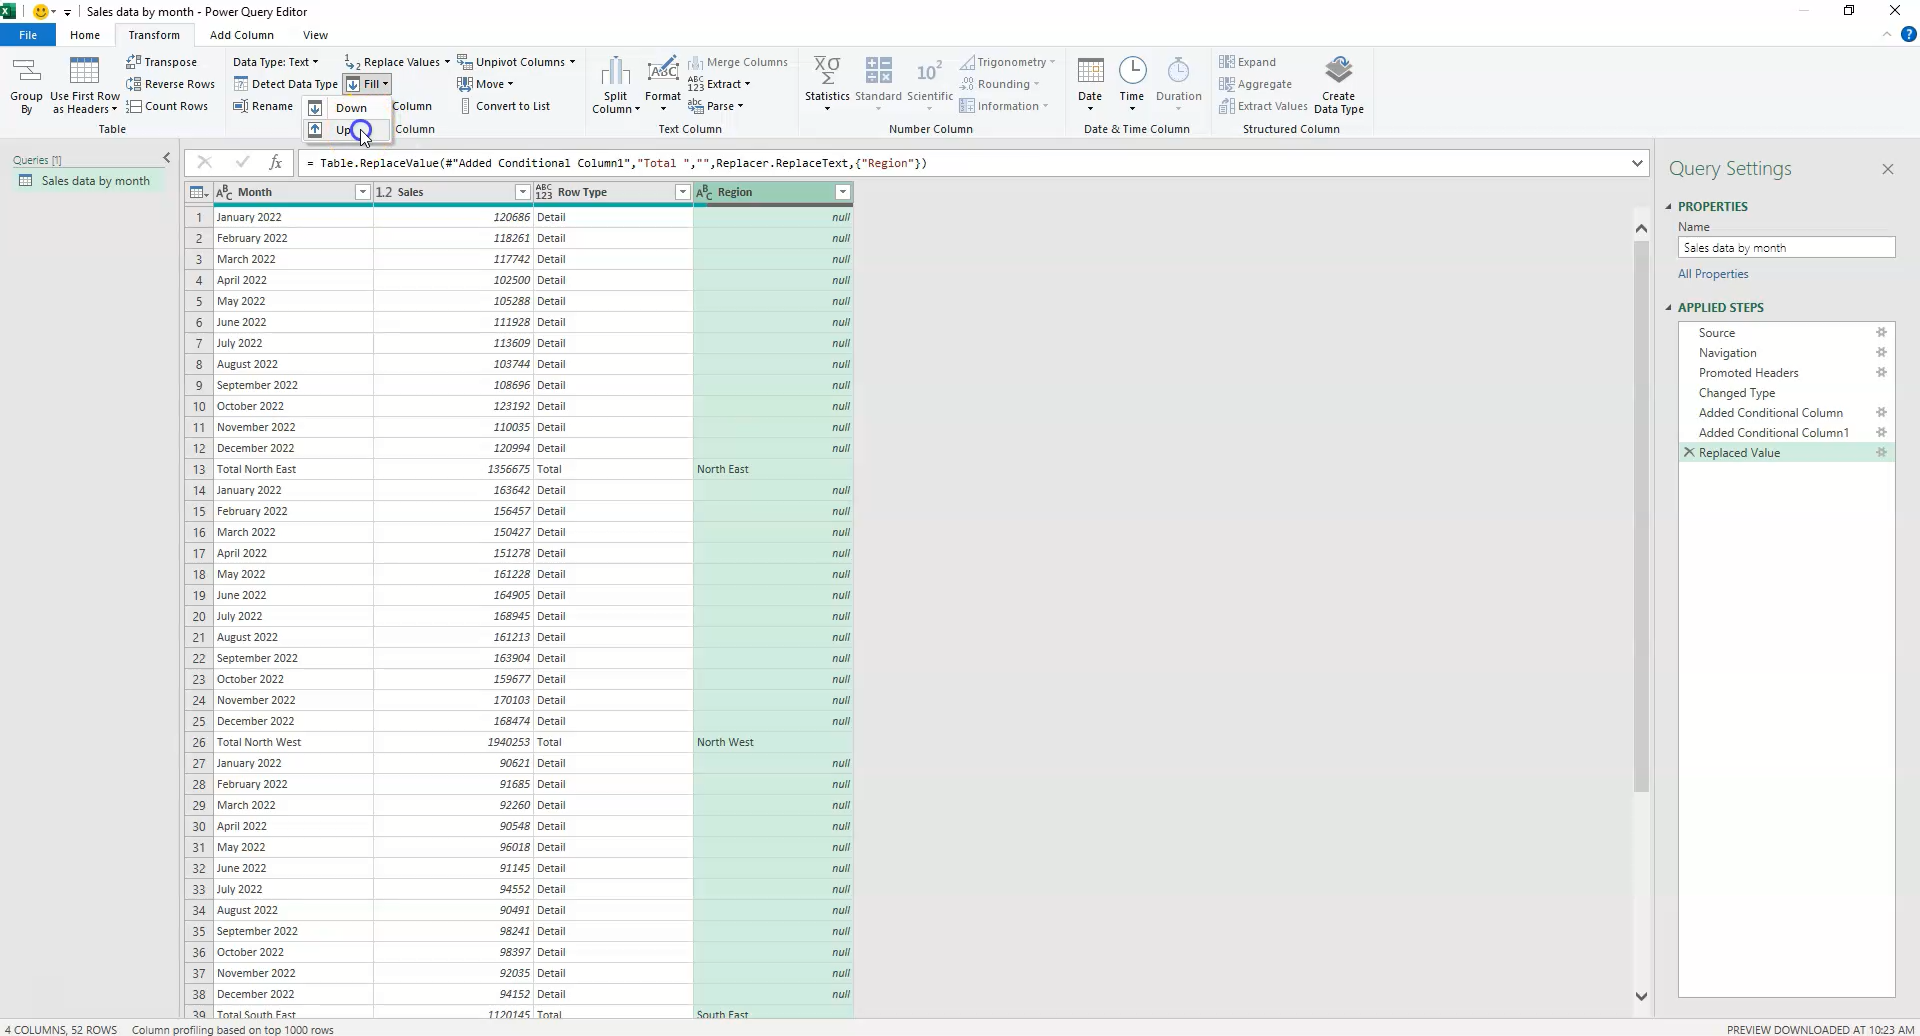
At this stage, your Region column will mostly be empty (null), with the Region names only appearing on the bottom "Total" rows.
Step 4: Clean the Text
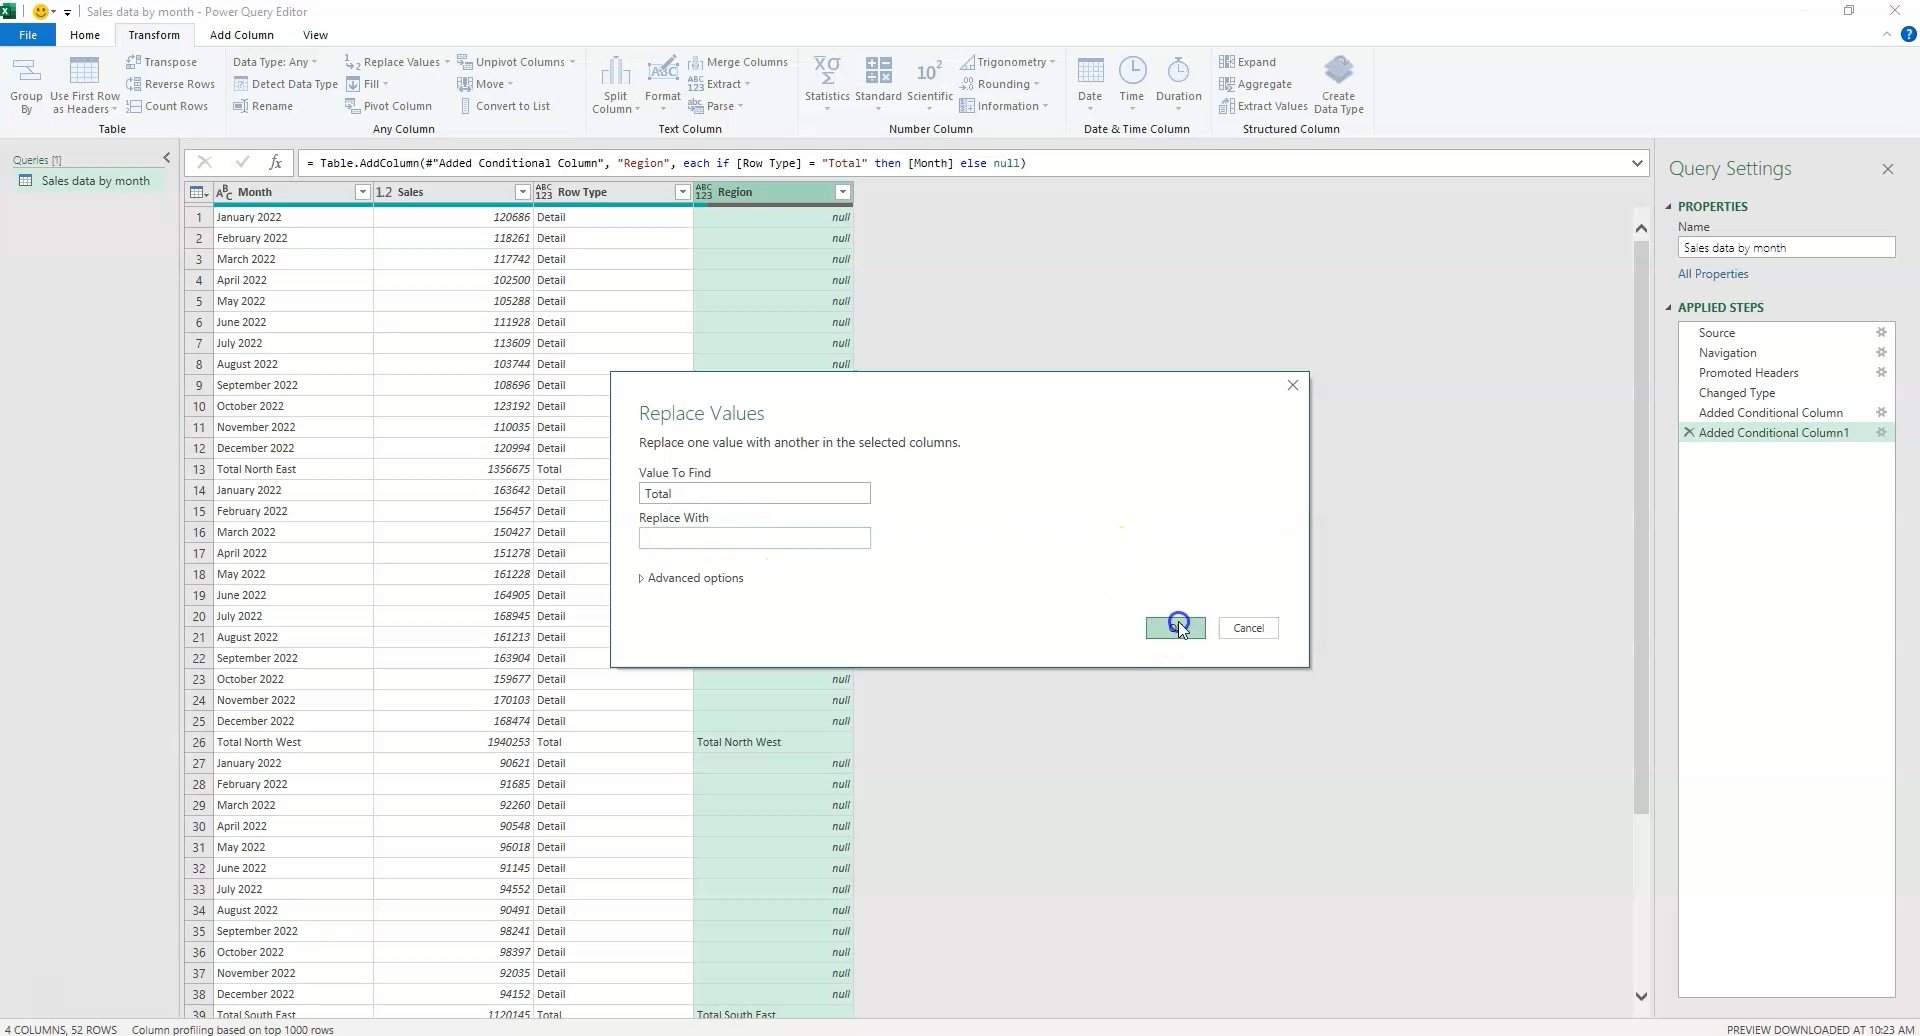
The extracted text likely says something like "Total North East." We need to remove the word "Total " to isolate the region name.
- Select the
Regioncolumn. - Go to the Transform tab and select Replace Values.
- Replace "Total " (ensure you include the space after Total) with nothing (leave the "Replace With" field empty).
Step 5: The "Fill Up" Technique
This is the most critical step. Usually, headers are at the top, and we use "Fill Down." However, because our category is in the subtotal row at the bottom, we need to Fill Up.
- Select the
Regioncolumn. - Go to the Transform tab.
- Click Fill > Up.
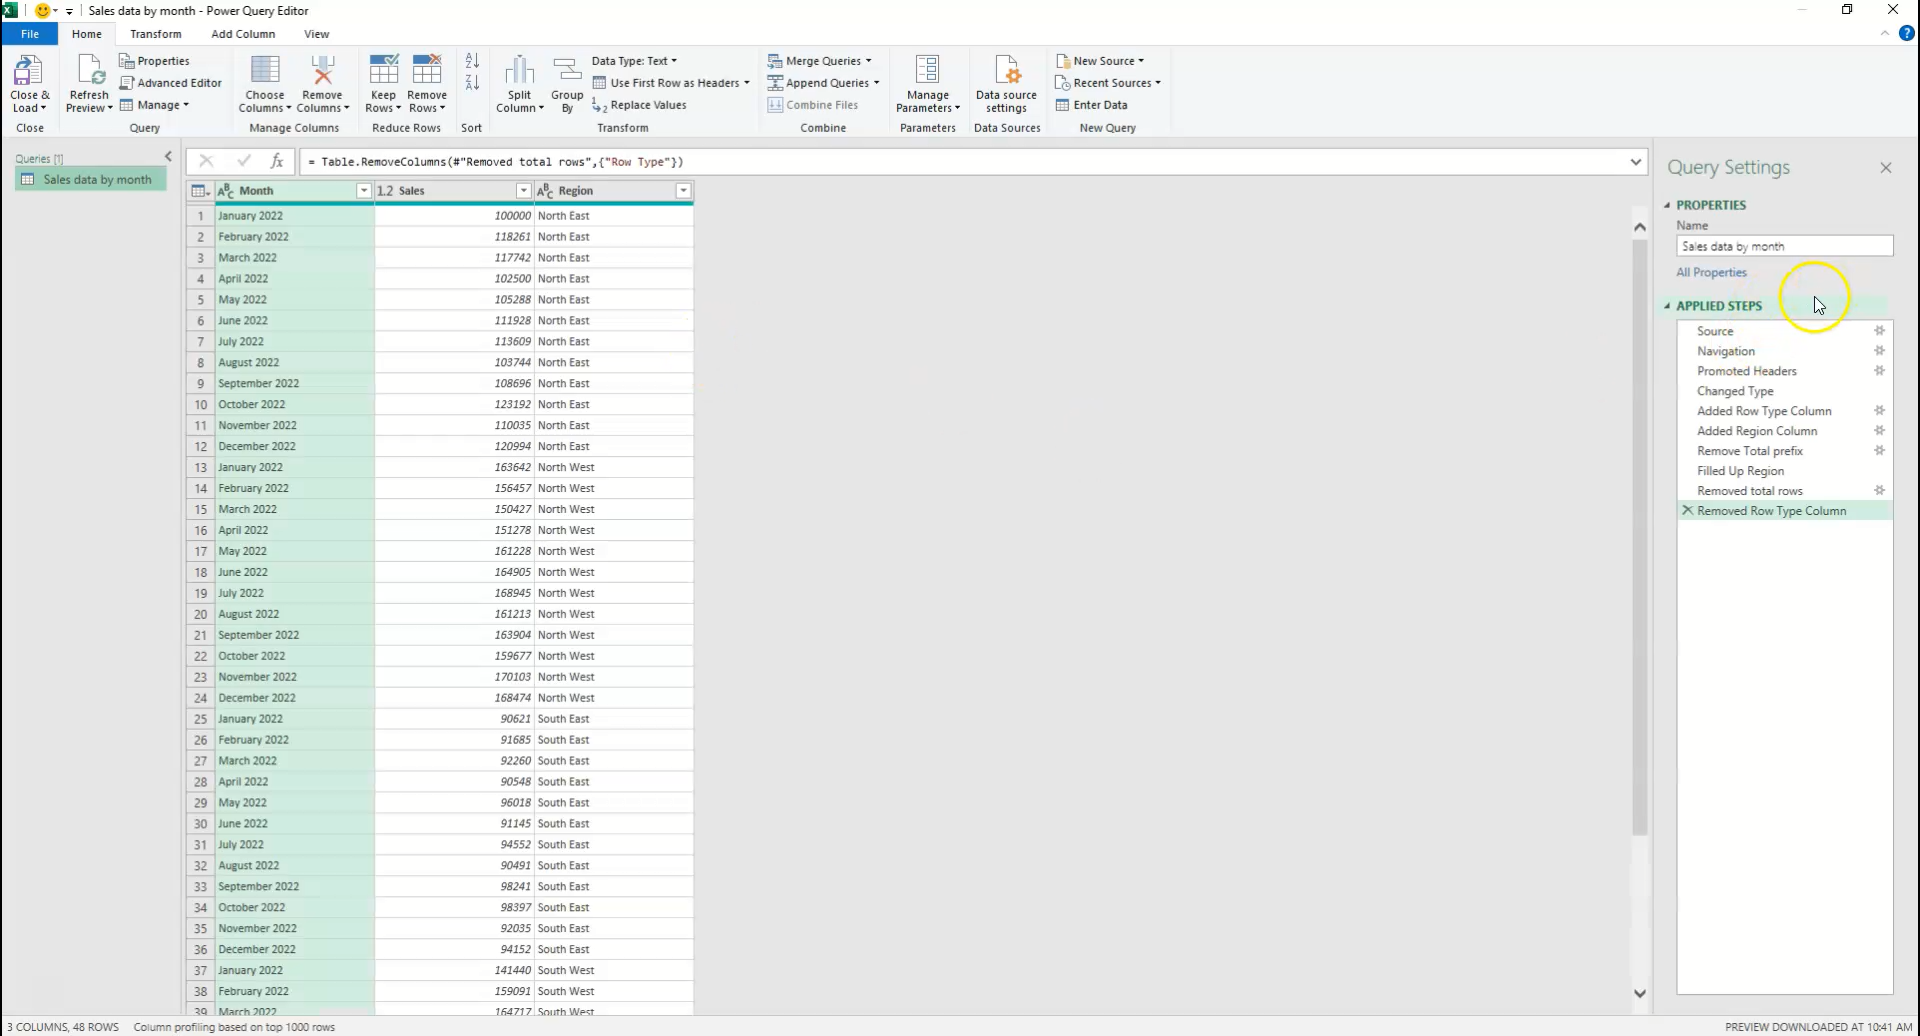
Power Query will take the value from the bottom row (e.g., "North East") and fill it upwards into all the null values above it until it hits the next block of data.
Step 6: Filter and Final Polish
Now that every detail row has a Region assigned to it, we no longer need the actual "Total" rows or our helper columns.
- Use the filter dropdown on the
Row Typecolumn to deselect "Total". This removes the aggregate rows from your dataset. - Right-click and Remove the
Row Typehelper column. - Close & Load the data back to Excel.
You now have a flat, tabular dataset that is perfect for Pivot Tables and Power BI.
Common Errors to Avoid
- Confusing Fill Down vs. Fill Up: If your category header is at the top of the data block, use Fill Down. If it is in the subtotal line at the bottom, use Fill Up.
- Missing the Space in "Replace Values": When removing the word "Total", if you forget to include the trailing space, your data will look like " North East" (with a leading space), which can cause sorting issues later.
- Hard-Coding Values: Avoid manually typing "North East" in your conditional logic. Always reference the column value so the solution works for any region (e.g., South West, Mid-West) that appears in future data.
Need Help Automating Your Reporting?
If you are spending hours each week manually cleaning data in spreadsheets, there is a better way.
At Judith Creek, we specialize in Data Automation, Power BI Reporting, and Strategic Consulting. We help businesses transform messy, manual processes into streamlined automated insights.
Contact us today at judithcreek.com to see how we can work together.