
In financial analysis and project management, we often face a common data problem: we have a single "Total Value" for a project with a Start Date and an End Date, but we need to report on it monthly or weekly.
In the accounting world, this is often called Revenue Recognition. You may have billed the client $50,000 upfront, but you earn that revenue over the 30 days the work is performed.
If you try to solve this with standard Excel formulas, it gets messy fast. However, using Power Query (available in both Excel and Power BI), we can transform a single row of data into a daily schedule effortlessly.
Here is how to do it.
Step 1: Prepare Your Data
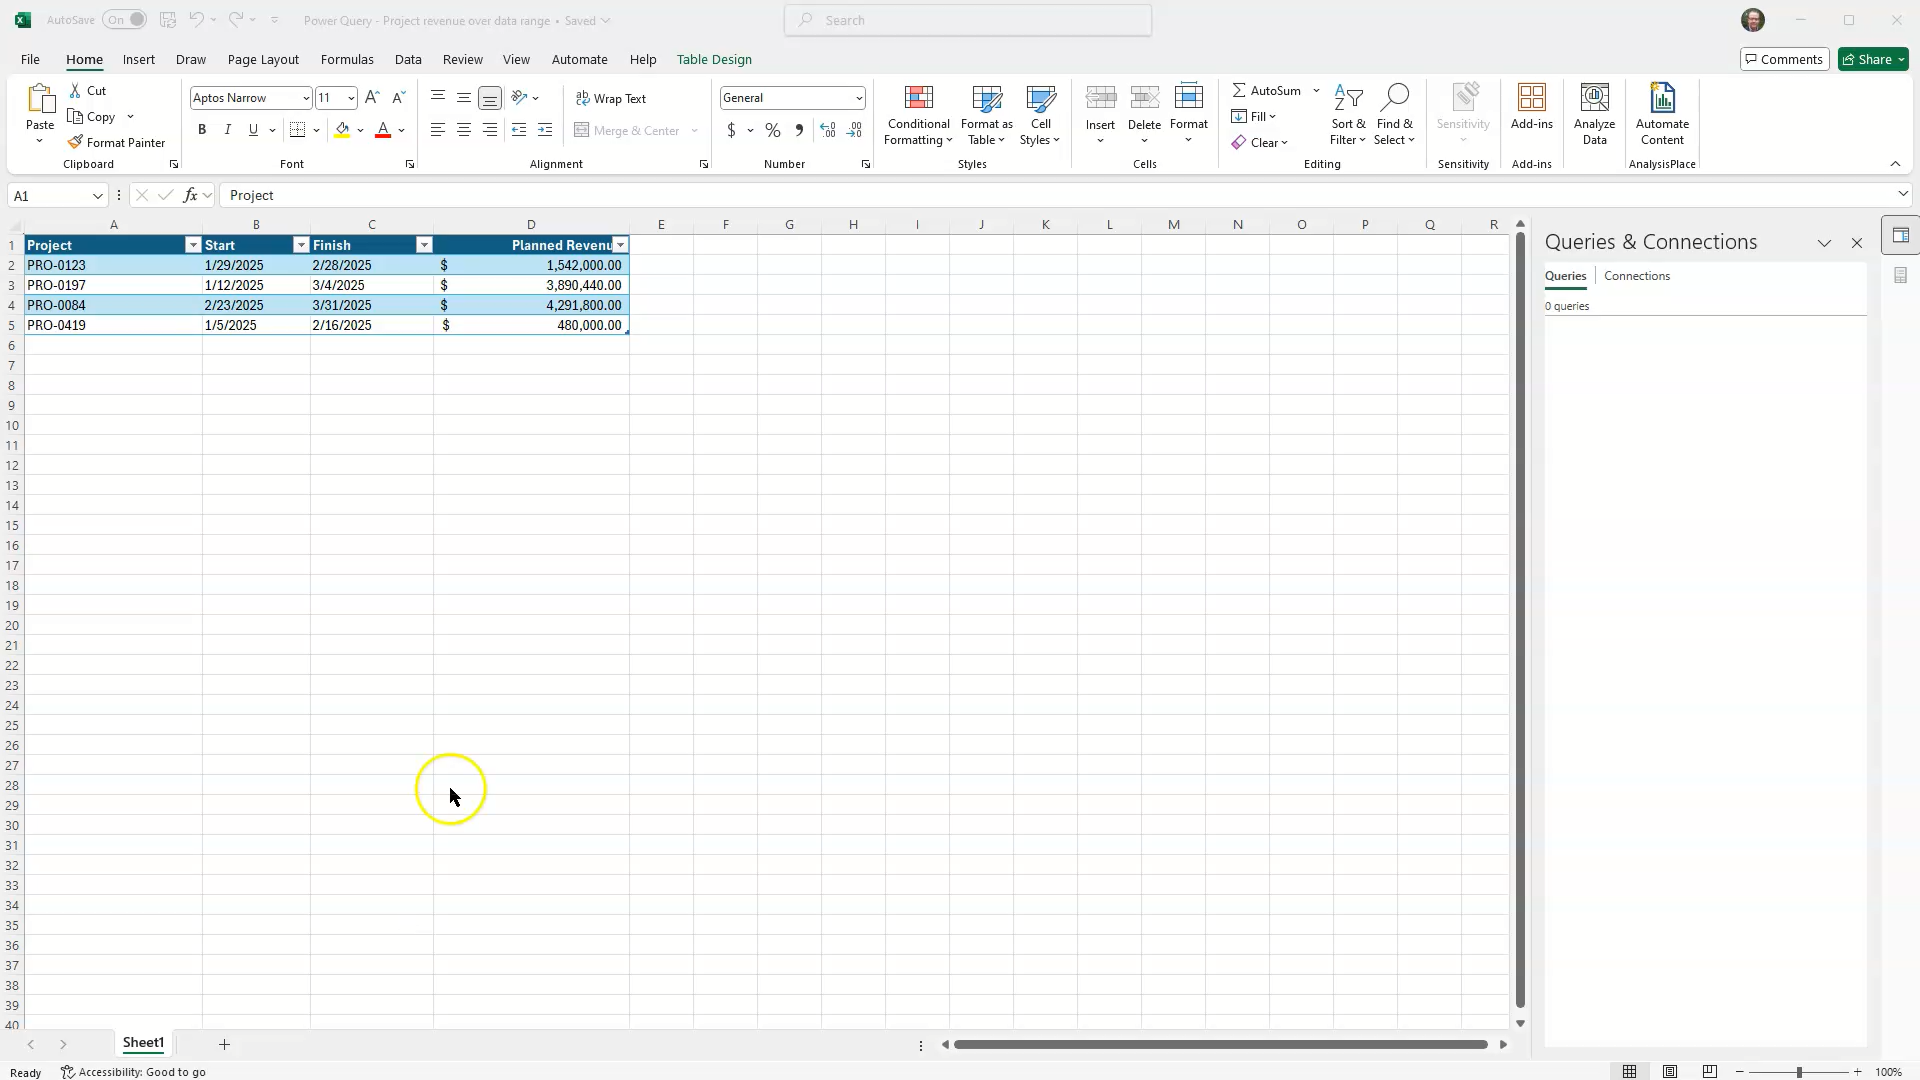
Start by loading your table into Power Query (Data > From Table/Range).
Ensure your column headers are clear (e.g., Start, Finish, Planned Revenue).
- Crucial Step: Ensure your Start and Finish columns are set to the Date data type, and your Revenue is set to Decimal Number.
Step 2: Calculate the Daily Rate
Before we create new rows, we need to know how much revenue to allocate to a single day.
-
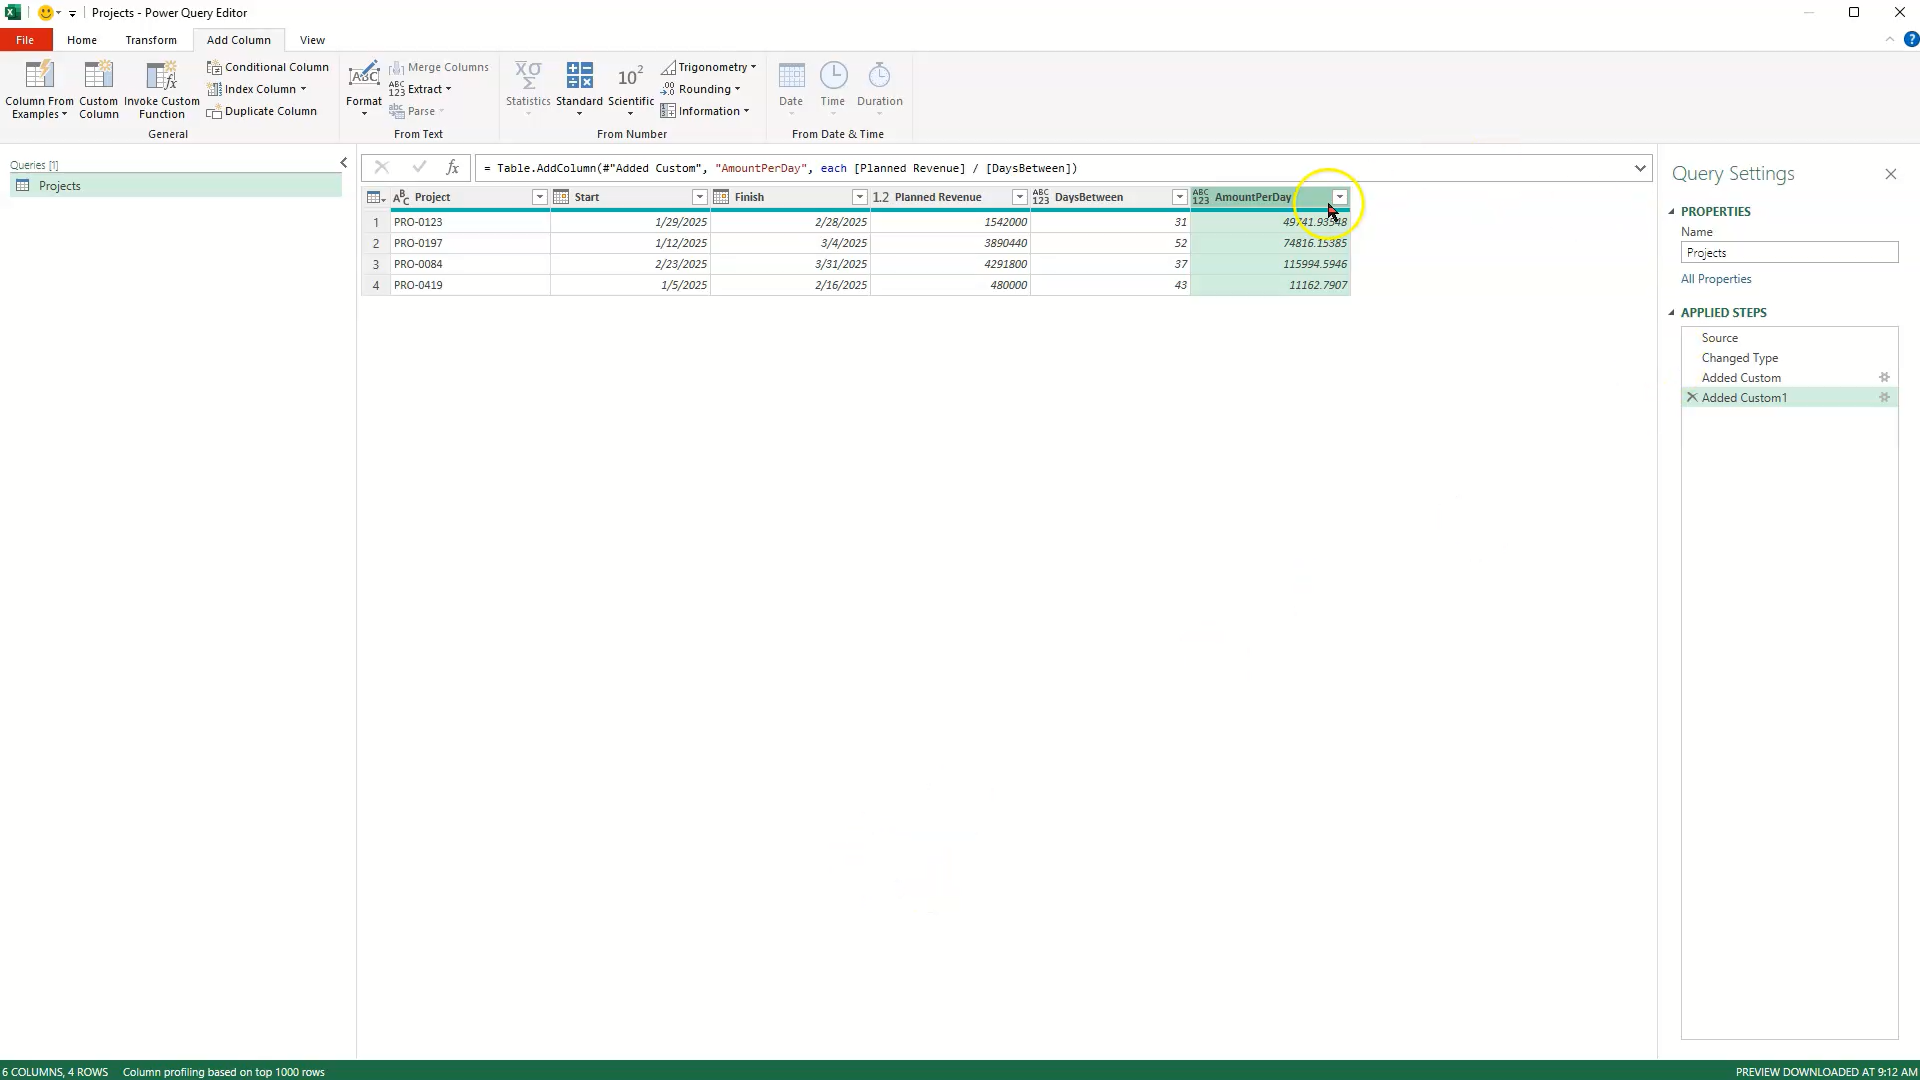
Calculate Duration: Add a Custom Column named
DaysBetween. Use the formula:Duration.Days([Finish] - [Start]) + 1(Note: We add +1 to include both the start and end dates in the count). -
Calculate Daily Amount: Add a Custom Column named
AmountPerDay. Use the formula:[Planned Revenue] / [DaysBetween]
Step 3: The "Magic" Code Explained
To automate this, we need a small script that looks at the Start Date and Finish Date and creates a list containing every single day in between.
We will use the Advanced Editor in Power Query to write a custom function using the M language.
- In the Power Query ribbon, go to Home > New Source > Other Sources > Blank Query.
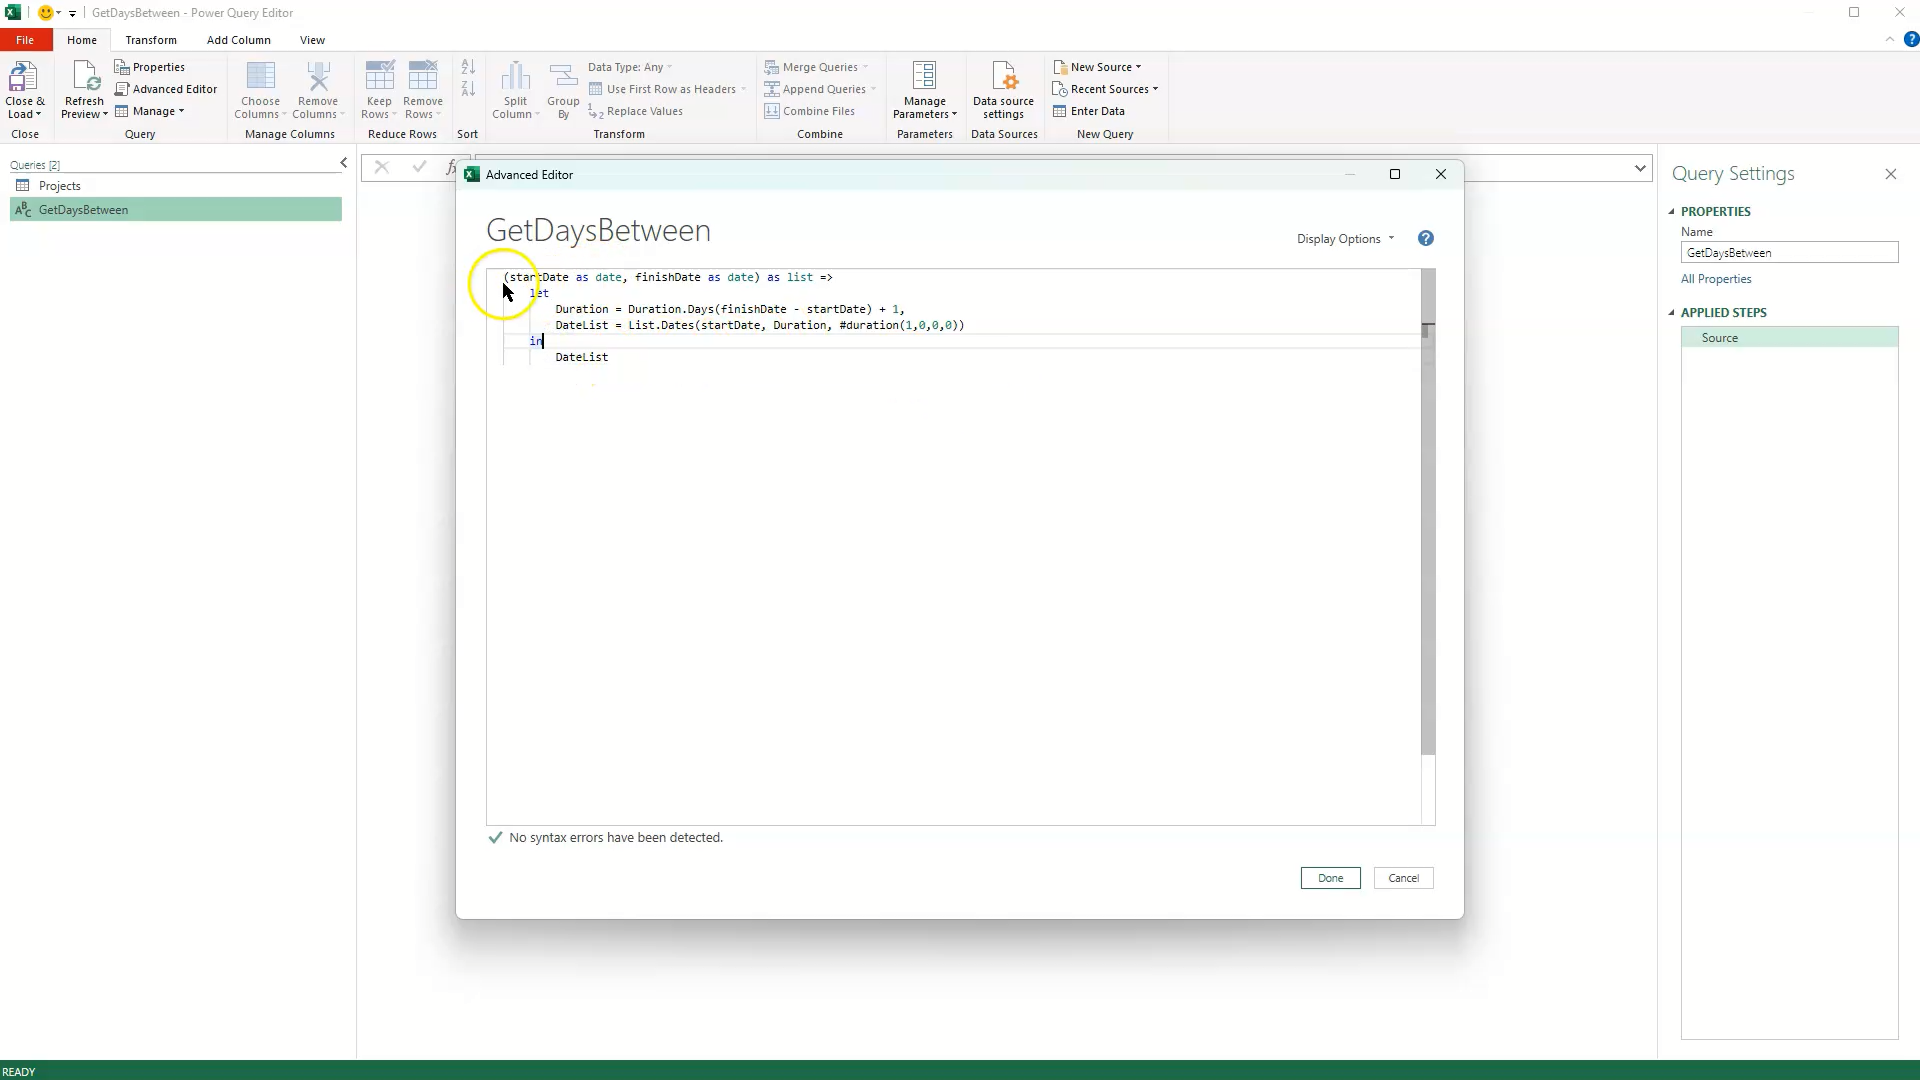
- Click Advanced Editor.
- Paste the following code (replacing whatever is currently there):
(StartDate as date, FinishDate as date) as list =>
let
    // Calculate the number of days between the dates.
    // We add +1 to make it inclusive (e.g., Jan 1 to Jan 1 is 1 day, not 0).
    Duration = Duration.Days(FinishDate - StartDate) + 1,

    // Generate the list of dates using the List.Dates function.
    // Arguments: (Start Point, How Many Items, Step Size)
    DateList = List.Dates(StartDate, Duration, #duration(1,0,0,0))
in
    DateList
💡 How this Code Works (Line-by-Line)
If you are new to M-Code, here is exactly what is happening under the hood:
-
(StartDate... FinishDate...) =>: This first line tells Power BI/Excel that this is a Function, not a static table. It defines the two "ingredients" (inputs) required: a Start Date and a Finish Date. -
Duration.Days(...) + 1: This calculates the count. If a project runs from Jan 1st to Jan 5th, standard subtraction gives you4. However, you need to account for all 5 days of work, so we add the+1. -
#duration(1,0,0,0): This looks scary, but it's simple. It stands for (Days, Hours, Minutes, Seconds). It tells the list to step forward by exactly 1 Day at a time.
Once you have pasted the code, click Done and rename this query GetDaysBetween.
Step 4: Invoke the Function
Go back to your original data table.
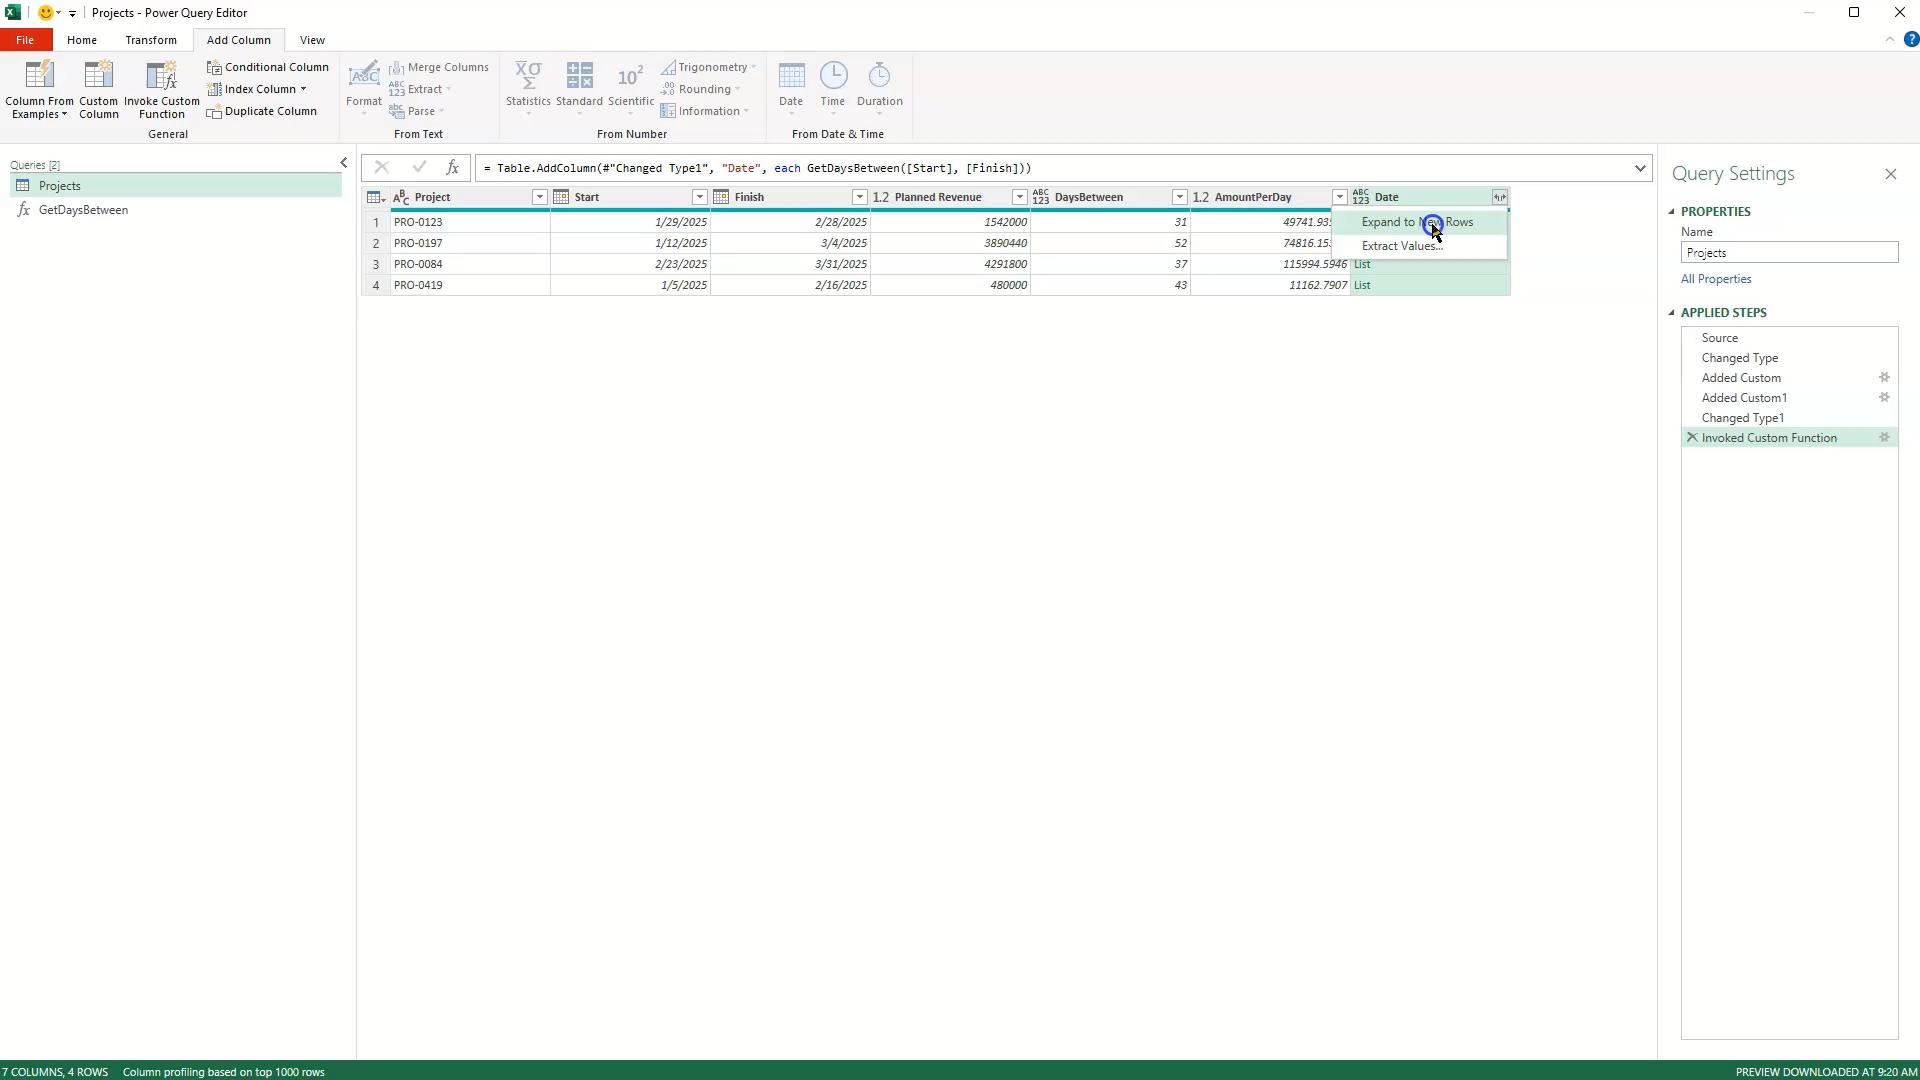
- Go to Add Column > Invoke Custom Function.
- Name the new column
Date. - Select your
GetDaysBetweenfunction. - Map the parameters: Set StartDate to your Start column and FinishDate to your Finish column.
This will create a column full of "Lists."
Step 5: Expand to New Rows
Now, we expand the data to create one row for every single day of the project.
- Click the Expand icon (the two arrows) at the top of your new
Datecolumn. - Select "Expand to New Rows".
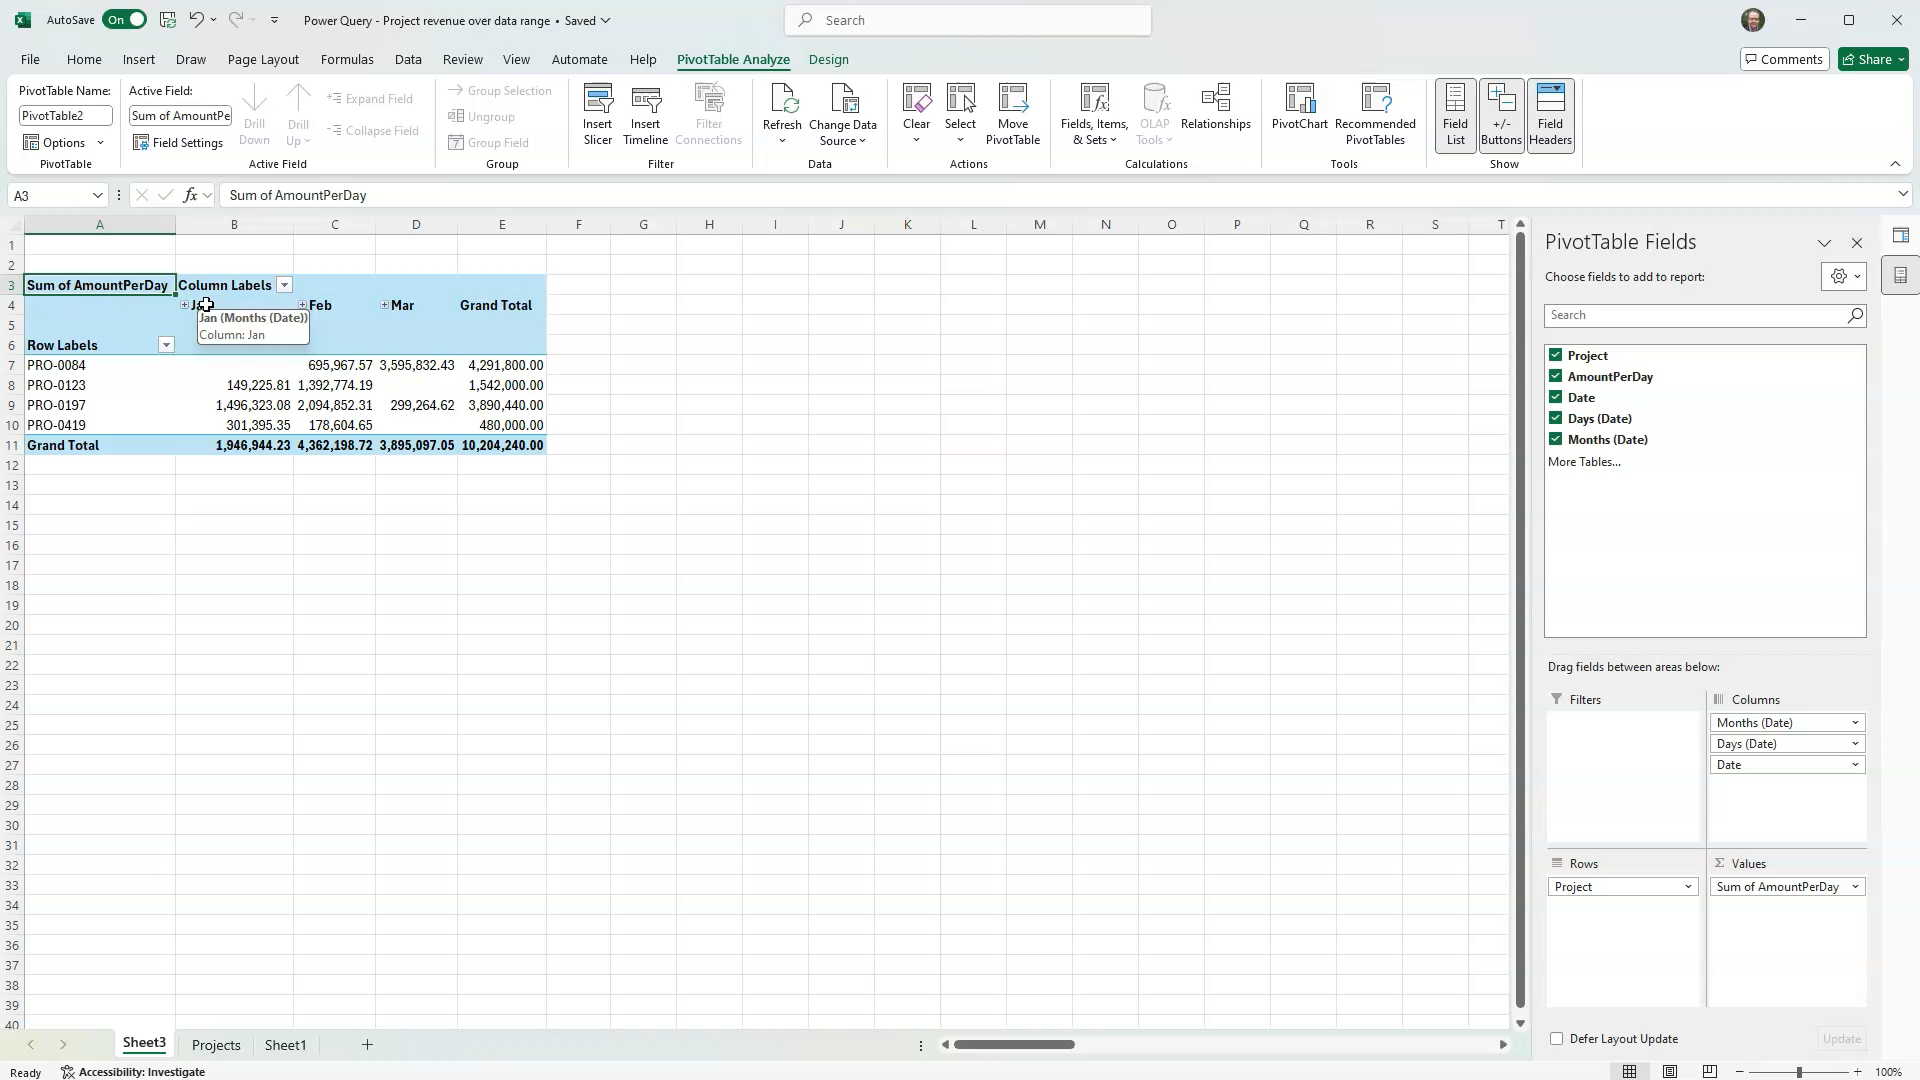
Step 6: The Result & Analysis
You now have a dataset where a project spanning 30 days has 30 individual rows, each with its specific date and the correct daily revenue amount.
- Close & Load the data back to Excel (or Apply in Power BI).
- Insert a Pivot Table.
- Drag your new
Datefield to the Rows (group by Month/Year) andAmountPerDayto Values.
You can now instantly see exactly how much revenue was earned in January vs. February, regardless of when the project started or ended.
⚠️ Common Errors & Troubleshooting
If you are new to Power BI or Power Query, you might run into a few specific hurdles. Here is how to fix them.
1. "We cannot convert the value to type Date"
The Issue: Your custom function fails to invoke, or you get an Error in every row of your new column.
The Fix: Check your data types in Step 1. The function explicitly asks for (StartDate as date). If your source columns are set to Date/Time or Text, it will fail. Ensure your Start and Finish columns are set strictly to Date.
2. The "Formula.Firewall" or Privacy Warning
The Issue: A yellow bar appears saying: "Information is required about data privacy." The Fix: This happens when Power Query combines data from different sources. For a quick fix in a local file, click Continue on the yellow bar, check the box "Ignore Privacy Levels checks for this file," and click Save.
3. The "Missing Day" Error
The Issue: You check your totals, and the revenue is slightly lower than the original Project Total.
The Fix: You likely forgot the +1 in the duration calculation. Subtracting dates gives the difference, not the count. Ensure your formula is: Duration.Days([Finish] - [Start]) + 1.
🚀 Take Your Data to the Next Level
This tutorial is just one example of how Power Query and Power BI can transform hours of manual data entry into a simple, refreshable click.
If you are looking to automate your organization's reporting or need a custom solution for tracking project revenue, I can help.
At Judith Creek, I specialize in:
- Data Automation: Transforming messy spreadsheets into clean, usable insights.
- Power BI Reporting: Building dashboards that give you answers instantly.
- Strategic Consulting: Helping you define the right metrics for your business.
Stop wrestling with Excel and start analyzing your data. View My Consulting Services at JudithCreek.com